Voice over IP (VoIP) allows voice services to run over IP
networks. This post describes the basic concepts of the technologies and
protocols used in a VoIP environment.
A Basic SIP Call Flow

How to Analyze VoIP SIP Calls in Wireshark


Two
types of traffic exist in a VoIP platform: signaling and media. Signaling
messages are used in order to establish, control and terminate calls, while
media traffic is the actual voice data. First signaling messages are exchanged
between the endpoints in order to establish a session and negotiate various
media parameters. As soon as this step is completed, then media are allowed to
pass through this session using the negotiated parameters. In order to modify
the session during the call or to even terminate the call, signaling messages
need to be exchanged again.
The dominant signaling protocol used for VoIP today is the
Session Initiation Protocol (SIP). SIP contains a variety of signaling messages
(requests and replies), and it uses different logical entities in order to
process the calls. During the signaling setup, the SIP messages contain a
Session Description Protocol (SDP) body which is the protocol used to negotiate
the various media parameters between the endpoints (such as IP addresses,
codecs, etc.). Finally, for the media the Real-Time Transport Protocol (RTP) is
used in order to carry the voice packets. More information about the protocols
used in VoIP can be found in the corresponding Request For Comments (RFC):
Overall the voice data can travel via different kind of
networks; most commonly via traditional TDM-based PSTN networks and, in the
case of VoIP, via IP networks such as the public Internet. The end-user devices
can be either IP-based phones (such as softphones or IP phones) or regular PSTN
telephones. This means that there can be different call scenarios between users
where a single call has to traverse through different networks, for example:
PSTN-to-IP or IP-to-PSTN, which requires translation techniques between the
different platforms.
To summarize, the table below presents the network components
that a VoIP solution can consist of:
|
VoIP network components
|
Description
|
|
End-user devices
|
They are the endpoints of the
calls and can be either IP- or PSTN-based.
|
|
Proxy server
|
They process the signaling
messages on behalf of endpoints and control the calls.
|
|
Session Border Controller (SBC)
|
They are placed in the border of a
VoIP network and provide topology hiding, security, session management, etc.
|
|
Gateways
|
They are responsible for the
interconnection and translation between VoIP and PSTN platforms.
|
In later posts, I will describe more in detail the different
protocols and procedures used in VoIP
A Basic SIP Call Flow
There are many different SIP scenarios and call flows in a VoIP
environment. This post describes a very basic SIP call flow case where A is the
caller and B is the recipient. Users A and B probably have a SIP proxy server
each handling the signaling on behalf of them.
When A wants to initiate a
new call, it sends an initial INVITE to B. This INVITE contains various headers
with signaling information such as A’s and B’s addresses/phone numbers, SIP
path information, etc. The INVITE also carriers a Session Description Protocol
(SDP) body with information regarding the media settings that A
supports/prefers e.g. codecs and media addresses. When B’s SIP proxy
receives the INVITE, it sends back an “100 Trying” SIP response which means
that it has accepted the INVITE and it processes it. When B’s phone starts
ringing, a “180 Ringing” is sent back to notify A.
When B answers the phone, a “200 OK” SIP message is sent back to
A. This message usually contains a SDP body with the media settings that B
supports/prefers. The point here is that A and B -via SDP- are negotiating the
media parameters that will be used during the call. Finally A replies
with an ACK in order to confirm that the “200 OK” has been received. From that
moment, the two parties can start speaking with each other using the negotiated
media parameters. When one of the parties releases the call, a BYE message
is sent to the other party who in turn sends back a “200 OK” to confirm the
call release.

Note that it is possible that other SIP messages contain a SDP
body as well, for example the “180 Trying” (taking into consideration the
RFCs). Note also that there could be other intermediary SIP devices in the
path between A and B, e.g. a SIP proxy or B2BUA.
This example is a very basic scenario of how a successful SIP
call can be established and terminated. Later posts will describe more in
detail the various SIP call flows as well as signaling and media parameters and
messages.
Introduction to SIP
The Session Initiation Protocol (SIP) is the dominant signaling
protocol used in VoIP today. It is responsible for the establishment, control
and termination of sessions by exchanging ASCII-text-based messages between the
endpoints. This post goes through the basic components of SIP: messages and
logical entities.
There
are two types of SIP messages: requests and responses. The table below
summarizes the most important SIP requests and the types of SIP responses:
|
SIP Requests
|
SIP Responses
|
||
|
INVITE
|
It initiates the session.
|
1xx Provisional
|
The request is received and is
being processed.
|
|
REGISTER
|
It requests the registration of
the user.
|
2xx Success
|
The request was successfully
received and accepted.
|
|
ACK
|
It confirms final responses.
|
3xx Redirection
|
Further process is needed for this
request.
|
|
BYE
|
It terminates the session.
|
4xx Client Error
|
The request has bad syntax or
cannot be processed.
|
|
CANCEL
|
It cancels the current signaling
process.
|
5xx Server Error
|
The server cannot process the
request.
|
|
OPTIONS
|
It negotiates the capabilities of
endpoints.
|
6xx Global Failure
|
Request cannot be processed by any
server.
|
There are various logical entities in a SIP environment that are
responsible for processing the SIP messages and they serve different roles. The
table below provides an overview of logical entities:
|
SIP Logical Entities
|
Description
|
|
User Agent (UA)
|
It is the endpoint of a SIP
session and can function as a Client (UAC) or a Server (UAS). The clients are
sending new requests (e.g. to initiate or terminate sessions) while the
servers are processing and responding to the requests.
|
|
Proxy Server
|
It acts on behalf of the end users
functioning both as UAC and UAS.
|
|
Registrar Server
|
It is responsible for registering
the contact and location information of the users (processing the REGISTER
requests).
|
|
Redirect Server
|
It returns information about the
location of the called party.
|
|
Back-To-Back User Agent (B2BUA)
|
Acts as an intermediary in a SIP
session. It can process SIP messages, alter their content and regenerate them
to the other party. Typical example of B2BUA is the Session Border Controller
(SBC).
|
In a call scenario all these entities are working together and
exchanging SIP messages during the signaling phase. SIP is also co-operating
with other protocols in a VoIP environment such as the Session Description
Protocol (SDP). All the above VoIP entities and protocols, as well as the
various call flows and troubleshooting procedures will be analysed extensively
in later posts of this blog.
How to Analyze VoIP SIP Calls in Wireshark
Analyzing SIP packets is
one of the most common ways to troubleshoot VoIP issues in the network or
systems. Wireshark is a very helpful tool when it
comes to analyzing VoIP SIP calls. Therefore, it is good to be able to
monitor the VoIP traffic and capture the SIP packets. Wireshark provides the
possibility to detect the VoIP calls in a trace and analyze them accordingly.
In order to detect the
VoIP calls in a Wireshark trace, you need to select from the top menu: Telephony –> VoIP Calls. Then
a new window appears which lists all the calls that were found in the trace,
and information regarding the start/end time, From/To headers, etc. Select
a call from the list, and press “Flow“. Then
you can see the call flow in a graphical environment. If you are interested to
check the content of a particular message, you can click on that message in the
flow and you will be able to see it in the main window.
If the trace contains RTP
packets, then you are able to see the RTP streams in the flow as well. In order
to check the RTP packets, you can select them in the flow and view them in the
main window. Moreover, if you would like to listen the RTP streams (for example
to check the voice quality), you can click on the “Player” button
in the window with the VoIP calls and the decoded RTP streams will appear.
Further information about analyzing RTP streams in Wireshark will be provided
in a different post.
Note: You
can identify specific calls in Wireshark based on their Call-ID header which is
unique for each call. This is helpful especially when a trace contains a lot of
calls, and you need to keep track of them.
You have always the
possibility to filter on different values in Wireshark in order to identify the
packets/calls of your interest. In order to do that, click on the button “Filter:“, and
then in the new window, click on “Expression…“.
There you can find and expand the SIP protocol and choose the value/header to
filter on.
This post described some basics of using Wireshark for analyzing
VoIP calls. Later posts will focus deeper into analyzing and troubleshooting
SIP and RTP packets.
Vendors would have you believe you need to spend thousands of
dollars on protocol analyzer software to troubleshoot Voice over IP (VoIP)
networks. After all, voice quality suffers if packets are late, missing or out
of order. Fortunately, Wireshark is an open-source package that can do
everything these tools can and more.
Wireshark, formerly known as Ethereal, is a network protocol
analyzer. Its job is to listen to network traffic, display it in a format that
makes sense and then help you find problems. VoIP involves a complex set of
protocols that Wireshark can decode and relate to each other. For example, the
procedure to set up a call involves a different protocol than the voice traffic
itself. Wireshark uses the information from the call setup to better understand
the voice flow. With this data in your hands, you can isolate the cause of VoIP
problems.
To find the cause of VoIP problems, you must be able to follow
the flow of calls from start to finish and ensure that the correct events are
happening. This requires an understanding of both the underlying protocols and
some telephony concepts. Fortunately, Wireshark provides some excellent tools
to help interpret the data. The rest of this article focuses on using
Wireshark's tools to solve three common VoIP problems.
The first example is of a phone that's not working—every time a
number is dialed, the phone idles, and no ringing is heard in the earpiece.
Wireshark is used here to look at the traffic between the phone and the PBX.
Launch Wireshark as root, and select Capture→Options to bring up the
Capture Options dialog, as shown in Figure 1. Ensure that the correct interface
is being used; otherwise, you won't see the traffic. In this example, I am
capturing traffic on the PBX's only interface, eth0.
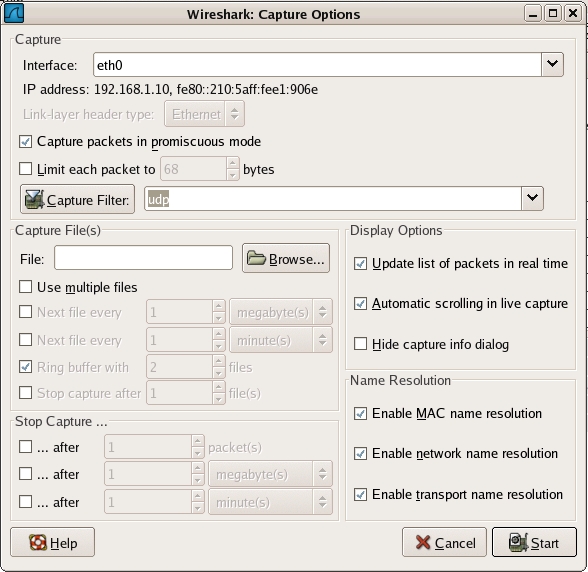
Figure 1. Wireshark Capture Options Dialog Configured for VoIP
Analysis
Before you capture, you have the option of specifying a capture
filter to limit the number of packets you have to deal with. Because both the
signaling traffic (SIP) and voice traffic (RTP) are UDP-based, I specify udp as
a capture filter. As a convenience, I also check the Update list of packets in
real time option so I can verify I'm getting the proper traffic. Click the
Start button to start capturing, and soon the upper pane will show several
packets (Figure 2).
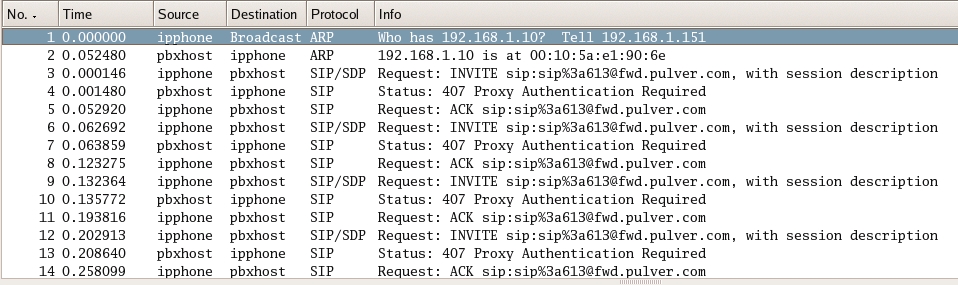
Figure 2. Wireshark Capture of an IP Phone's Traffic
Figure 2 shows the packet list. The first four columns show the
packet number, time and the addresses of the hosts involved. Because Wireshark
understands SIP, it is able to identify the packets as SIP in the Protocol
column and give detailed information in the Info column.
A cursory examination of the information in Figure 2 shows that
the same three packets repeat themselves four times. First, the ipphone host
sends a SIP INVITE message to pbxhost, which is used to open a conversation.
Next, the PBX responds with “407 Proxy Authentication Required” to which the
phone responds with an ACK, and then tries again in packet 6. Because this
process repeats itself continuously, it's a good guess that the phone is trying
to authenticate with the wrong user name and password.
Monitoring: It's All About Location
If some of the packets you are looking for don't reach the
network interface of the machine running Wireshark, you've got a problem.
Switched networks, by design, try to limit the traffic only to the ports
involved with the communication in order to improve performance. Spanning trees
and IP routing only complicate the matter of trying to find out where to put
your probe.
Your best bet is to capture traffic directly on one of the
machines involved. If you can't get Wireshark on that machine (it runs on
Windows too), you always can capture traffic locally with tcpdump and ship the
trace to another machine for analysis. If that isn't possible, or if the
traffic spans multiple machines, it's time to get help from your network hardware.
Most managed switches offer a feature that will mirror all the
frames from one interface to another. Thus, you could plug your Wireshark
station in to a switch port with your Internet connection, mirror all the
traffic from the Internet router to your workstation, and you'd be able to
analyze all Internet traffic. Cisco calls this Switchport Analyzer or SPAN, HP
calls it a Monitor Port, and 3Com calls it a Roving Analysis Port.
The choice of which port to mirror depends on your network, but
generally, ports that connect to other switches or routers are a good bet. This
is also where capture filters help reduce the background noise you have to deal
with.
The first example made use of Wireshark's high-level
interpretation of individual packets to help highlight a simple problem. The
next example requires a more holistic view of a VoIP call. Here, Wireshark is
used to view the SIP call setup and then identify the critical packets. In this
example, a phone is experiencing one-way audio. Outbound phone calls ring and
are picked up, but only one party hears audio. The conversation was captured in
the same manner as in the previous example, resulting in 140 frames. This is
too many to look at without some help, so some of Wireshark's advanced analysis
tools are used.
With the capture loaded, select Statistics→VoIP calls. Wireshark
analyzes the capture for any VoIP-related packets and provides a summary on the
screen. Click on the call (if there are multiple calls shown, hold down the
Ctrl key to select additional calls), and click on the Graph button. You will
see a summary of the SIP call, as shown in Figure 3.
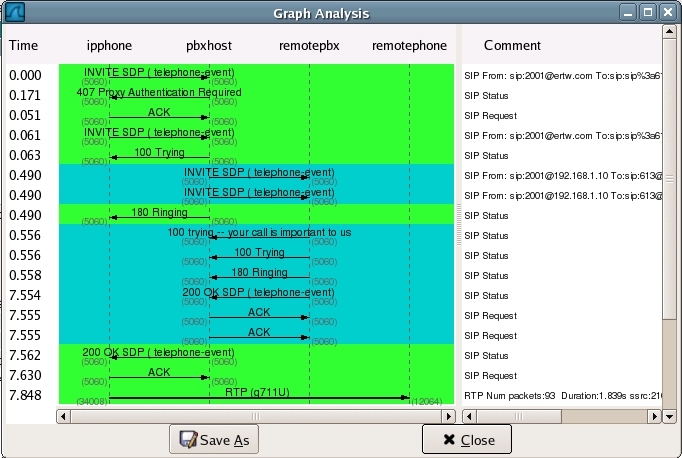
Figure 3. Wireshark's Graphical Interpretation of a SIP
Conversation
The Graph Analysis dialog shows the SIP messages sent by the
various parties. The first message in Figure 3 is an INVITE message, which is
the first step in setting up a call. In this case, the IP phone is asking the
PBX to place a call to a SIP address of sip:613@fwd.pulver.com, which is an
echo service provided by Free World Dialup for testing SIP calls. The response
to this is a request for authentication, which is acknowledged. The phone tries
again and is given a status of “Trying” by the PBX. The PBX then proceeds to
INVITE the remote endpoint by contacting fwd.pulver.com. Several more messages
are exchanged before the call is set up properly.
The problem at hand is one-way audio. Indeed, the Graph Analysis
window shows that the IP phone sent Real-Time Protocol (RTP) voice data to a
SIP endpoint on the Internet, but it does not show a stream in the reverse
direction. To determine why no audio was sent back, it is necessary to read
deeper into the SIP packets.
One of SIP's jobs is to set up the RTP stream between two
endpoints. It does this through the Session Description Protocol (SDP), which
carries the information about codecs, IP addresses and port numbers that is
necessary for VoIP to work. Note that the endpoints speaking SDP need not be
the ones talking to each other! In Figure 3, pbxhost and fwd.pulver.com are
negotiating with each other over the Internet, but they each specify a
different endpoint to terminate the voice call. The RTP streams are
unidirectional, so a full duplex conversation requires a separate RTP stream to
be set up in each direction, using two separate SDP messages.
With that in mind, it seems prudent to find out the SDP
information sent from pbxhost to fwd.pulver.com. This SDP message will contain
the IP address, UDP port and codec that the remote end is to use to talk to the
local IP phone. SDP messages are tagged with SDP in the Graph Analysis window
to help you spot them. This packet is at offset 0.490 in Figure 3. When you
click on the message in the Graph Analysis window, the corresponding packet is
highlighted in the packet list pane of the main Wireshark window.
Wireshark also decodes the protocols contained within the
currently selected packet in the packet detail pane, in addition to providing a
summary of the packets in the packet list pane. Decodes are separated for each
layer, such as Ethernet, IP, UDP and SIP. You can dig into the fields by
clicking the arrows on the left side of the window. Figure 4 shows the SDP
message from above with some of the relevant fields expanded.
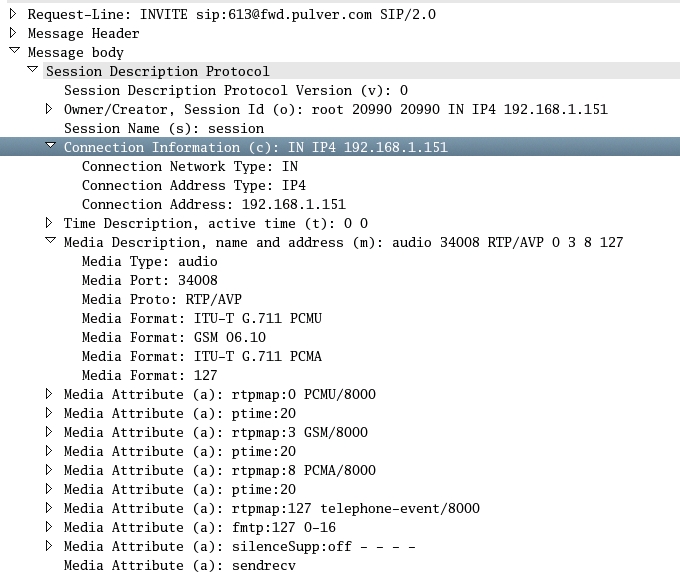
Figure 4. Wireshark's Display of a SIP Packet Containing an SDP
Message
Each line in an SDP message describes a particular attribute of
the session to be created and follows a simple attribute=value format, where
the attribute is a single letter and the value is a text string. Wireshark uses
its understanding of the protocol to add some extra text, such as descriptions
of the attributes. For VoIP sessions, the important attributes are:
- a—attributes,
such as codecs and silence suppression.
- c—connection
information, including the IP address expecting the RTP stream.
- m—media
description, including the port number on which the RTP endpoint will be
listening.
From the Connection Information (c) line, you can determine that
the host being sent is 192.168.1.151. The m attribute specifies that the RTP
stream is expected to be on port 34008. Looking through the attributes, the PCM
u-law and a-law codecs are offered, along with the compressed GSM format and
touch tones via the telephone-event media format. The problem with this
offering is the IP address 192.168.1.151 is a private address, unreachable from
the Internet. When the remote host tries to send packets to 192.168.1.151, the
packets are lost because no such route exists on the Internet.
For the sake of completeness, the SDP information for the other
side of the conversation is at time 7.554. After the offer is acknowledged, the
two phones begin sending voice packets to the address and port specified in the
earlier SDP messages. Because pbxhost offered an invalid address to
fwd.pulver.com, the other half of the voice call is never seen.
This illustrates a common problem when using VoIP through a NAT
gateway. The problem can be solved several ways depending on one's needs, but
that's another article!
So far, the troubleshooting has focused on the call signaling
aspect of VoIP. Once the endpoints begin sending RTP streams, the effects of
network quality can be heard in the audio.
Network conditions that affect VoIP are latency, jitter and packet
loss. Latency is the time it takes for a packet to travel from point A to point
B. Jitter is the variation in latency over a series of packets. Loss is the
number of packets sent from point A that never make it to point B. Because VoIP
audio is sent over real-time UDP, a packet that arrives out of order has to be
discarded if the packet ahead of it already has been played.
For the final example, I made a call and captured the
conversation including the call setup. Wireshark uses the SIP information to get
more details about the RTP packet stream, which enables the RTP analysis tools
to be used.
Select Statistics→RTP→Show
All Streams. Wireshark uses the decoded packets to provide a list of all the
audio conversations and some basic statistics, as shown in Figure 5.
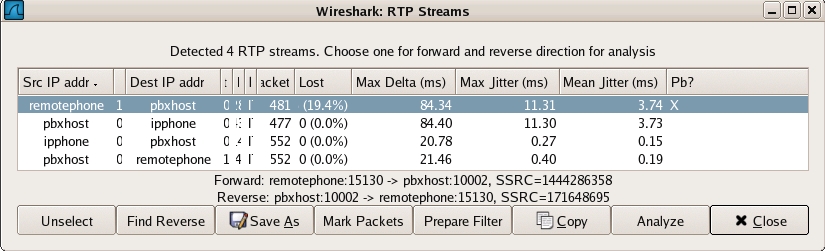
Figure 5. Wireshark's List of Found RTP Streams
Figure 5 shows four streams, because each audio stream comprises
two streams in opposite directions, and the PBX was bridging the connection
between the two phones. The first indication of a problem is the final field,
which shows an X when there are VoIP-related problems. The Max Delta (latency)
was 84ms for that stream, which is good. The Max Jitter was also good at 11ms
(150ms of one-way latency and 20ms of jitter are the limits of what's considered
acceptable). However, nearly 20% packet loss was encountered, which is
extraordinary!
Select the problematic stream for further analysis by clicking
on it. After that, click on the Find Reverse button to select the other half of
the conversation. Finally, click on Analyze to provide a packet-by-packet look
at the stream. Lost packets will show up as having the wrong sequence number.
This screen, shown in Figure 6, also displays helpful statistics, such as the
current bandwidth, latency and jitter.
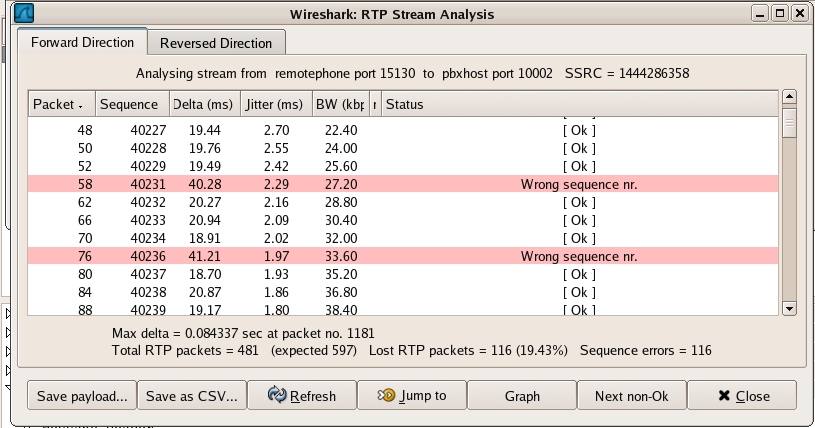
Figure 6. RTP Stream Analysis of a Stream with Excessive Packet
Drops
Figure 6 clearly shows some network problems, because the packet
loss is not normal. (The steady bandwidth and regularly spaced packet drops are
strong indicators of priority queue overruns or policing in network equipment.)
This loss will not be seen in the reverse direction, because the capture was
taken close to the source of the conversation. You can save the contents of the
window with the Save CSV button.
Network problems are more difficult to solve, because they
require interaction with network equipment and potentially with other parties.
If your VoIP environment doesn't use the Internet, you can capture packets at
various points on the network to find where the poor conditions are introduced.
If the call flows over the Internet, you must investigate your connection to
the Internet and possibly work with your carrier.
The RTP analysis can be used with proprietary systems with some
extra configuration. If Wireshark doesn't understand the signaling, it won't be
able to decode all of the RTP information. Select Edit→Preferences→Protocols→RTP, and check the Try to
decode RTP outside of conversations box. Analysis will be a bit slower, but
Wireshark will try to determine whether every UDP packet belongs to an RTP
stream, allowing you to use the RTP tools to look at the call.
The final feature we examine here is the ability to listen to
the contents of the voice call. With the Stream Analysis window still open,
select the Save Payload button, select the .au file format, and provide a
filename. After pressing the OK button, the voice call itself is saved to your
hard drive. The resulting file can be played in XMMS, soxplay or some other
audio program.
Troubleshooting VoIP is unlike most other network
troubleshooting, because of the separate signaling and voice protocols, and the
real-time nature of voice traffic. These three examples have shown the
important features of Wireshark that deal specifically with analyzing the SIP
call setup and RTP voice streams. These features rival those of commercial
products and enable to you find the root of VoIP problems.
No comments:
Post a Comment